In this post, I will go through a quick overview of how to debug and overcome mysterious 504 errors on AWS.
During mid-august, some of the traffic at Headout started receiving very unusual errors. There were instances of top-level documents not loading, stylesheets not loading, and icons not loading.
Headout web platform caters to 40 million users each year and serves over 3 billion requests each year.
Furthermore, all this and various other stuff managed by a team of ~20 pro engineers.
At Headout, we maintain a dedicated channel for all kinds of technical bugs, we call it #bug-alert. The idea is each week person from every team like QA, Frontend, and backend solves urgent production bugs.
Hard to reproduce🤕🤕
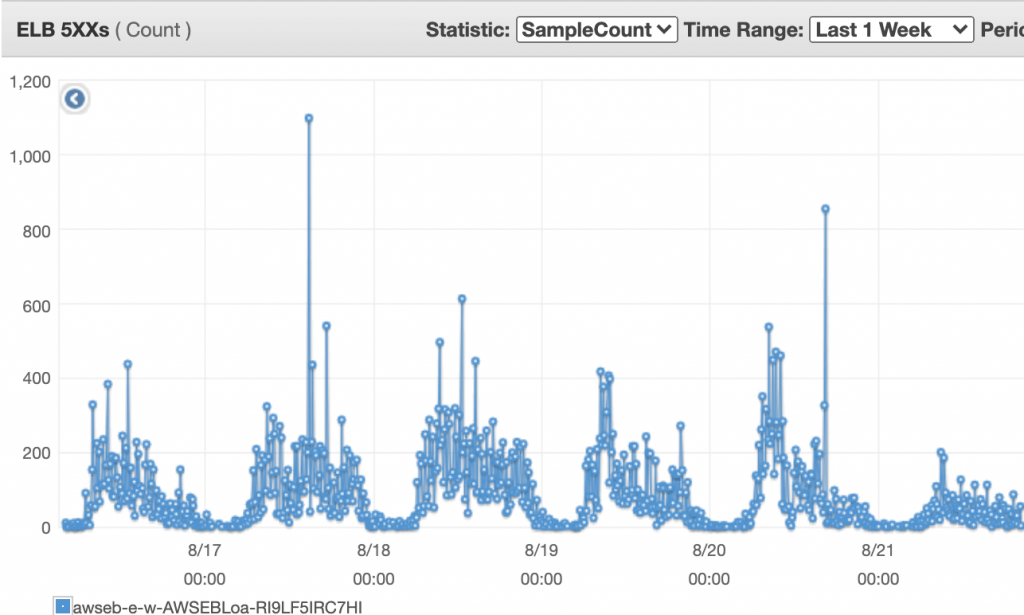
Now back to the problem, the request failing was both random and unusual. No of these requests was relatively low initially and then increased suddenly. Here is the graph of the issue at ELB.

The issue was challenging to reproduce, which made it harder to debug and solve. It was like finding a needle in the haystack. We tried the brute force approach to find the problem.
Here are the quick things that we tried
- Fix issues that were related to the request-response lifecycle chain.
- Change the proxy library that we were using, some users reported a memory leak in the library.
- Bypass internal proxy altogether.
Debugging the issue
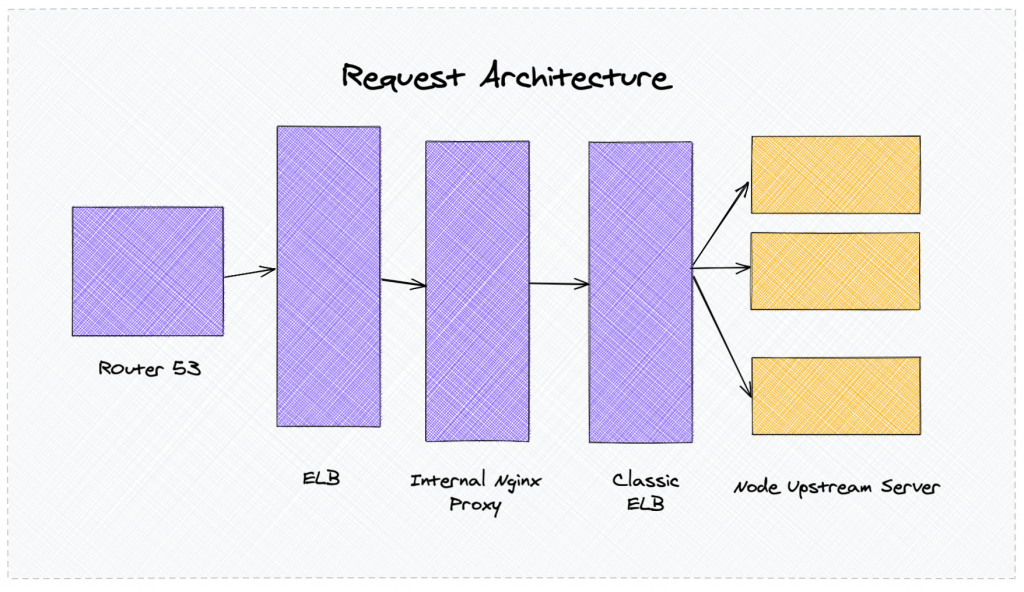
To understand this issue, we should look at our architecture. We currently use AWS services for our infra, particularly Elastic beanstalk and a variety of other services.
However, we are currently migrating to Kubernetes-based solution to have more control of our system.
Our current architecture

We have one public Nginx layer that routes the public traffic to internal services. At various layers, we have an internal proxy to handle the traffic. During mid-august, we migrated from our react-based SSR framework to Next.JS through a staged rollout deployment.
During this whole time, the stage rollout traffic being handled by our react server which was taking care of proxy.
Digging up the logs📖
During the log lookup, we noticed one thing. The response, processing time, transfer time for the request coming to ELB was -1. Moreover, the field of the target host was blank.
Here is one sample log. Format can be seen here :- AWS Docs on ELB logs
2020-08-21T12:22:30.612524Z awseb-e-w-AWSEBLoa-RI9LF5IRC7HI 10.0.6.24:59036 - -1 -1 -1 504 0 0 0 "GET http://book.barcelona-tickets.com:80/_next/static/chunks/c04d9d18188bc7b1d44032b97b21bf4fc203159c.4821a7a9ee278a3e6f96.js HTTP/1.0" "Mozilla/5.0 (iPhone; CPU iPhone OS 13_5_1 like Mac OS X) AppleWebKit/605.1.15 (KHTML, like Gecko) Version/13.1.1 Mobile/15E148 Safari/604.1" - -It meant the request was never going to the upstream server. Our server health state did not correlate to this.
Finding the root cause
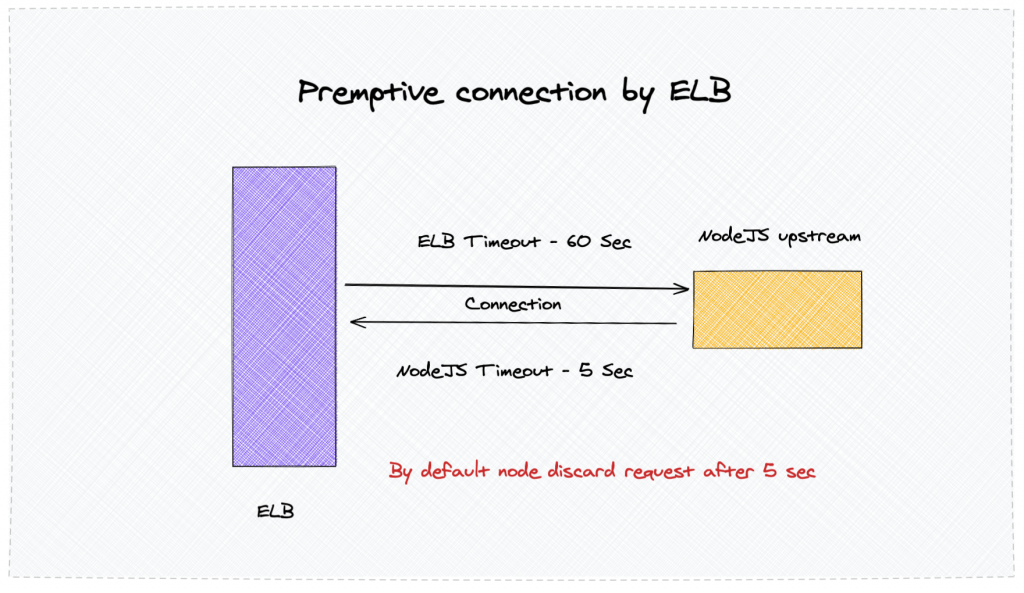
While reading up the logs, it appeared that AWS Load Balancer pre-opens connection with the upstream server. It is done so the server can respond fast to the client.
By default, the default connection time is 60 seconds.

Fault at NodeJS
We have various frameworks that we use Spring, Django, Express, and other frameworks in different languages. Most of the frameworks have the 60s as the default connection timeout. NodeJS, on the other hand, keep a connection active for only 5sec. More about it
So although the connection seems to be established earlier, it was closed by NodeJS. When a new request comes to the server, it is instantly rejected by ELB.
Solving the problem ✨✨
There were various ways to solve this problem. We decided to go with the first one.
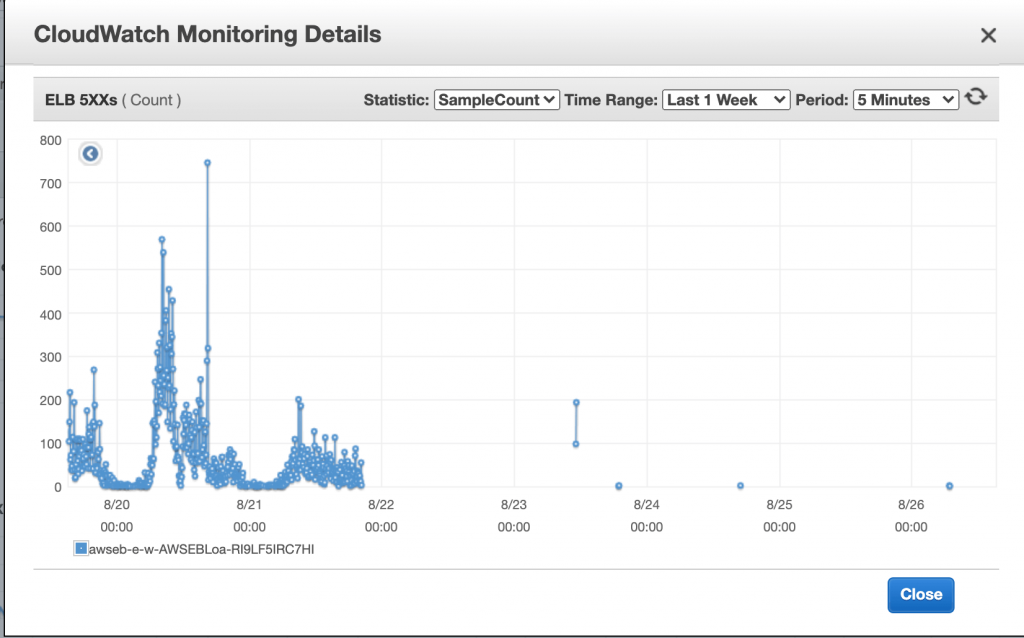
- Increase KeepAliveTimeout at NodeJS application from 5 sec to 60 seconds. Use can use the following code in the NodeJS applications:
- Keep-alive timeout sets default timeout connection where the request is not passing. Where header timeout represent time till which ongoing request will be kept alive.
- Ideally you should have headersTimeout = keepAliveTimeout + time taken by largest request serverInstance.keepAliveTimeout = 61 * 1000; serverInstance.headersTimeout = 65 * 1000;
- Decrease keepalive timeout at ELB setting to 5 seconds. However, this is not an ideal approach.
- Move from layer five proxy to layer seven proxy. Layer 5 proxy is like a virtual server that has to establish a connection between client and server to handle requests.

Learning
It was a very unexpected and random infra issue. One takeaway was:- you should always read the logs very carefully. It is super helpful in finding the root cause.
Also, it is important to look at the default configurations of frameworks. Integration between different systems can lead to issues which one would have not imagined otherwise.
Btw, We are now moving to ALB with Kubernetes and solving other complex problems at Backend, Frontend, and DevOps to handle these scales very efficiently.


